Within our program, oversight typically views fire protection related matters as black and white. This binary approach is not appropriate in determining whether
a fire safety strategy is adequate. Some required actions that oversight mandates apply draconian actions that provide very little benefit for the
cost. A lead engineer is expected to understand how probability of a casualty and frequency of events can be used to explain to oversight why a decision
regarding fire protection is adequate.
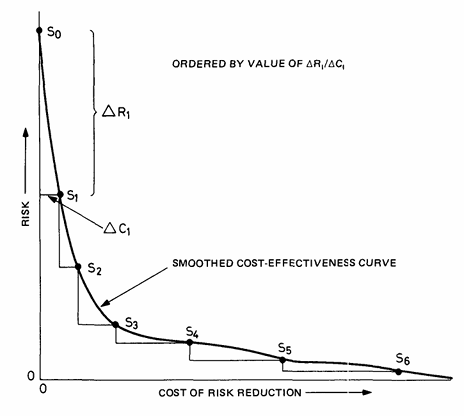
Figure 1: Relationship between cost and risk reduction.
Initial efforts to improve the safety of a system involve identifying and resolving issues with significant risk. Initial problems often can be
resolved with minimal cost but provide significant overall system benefits. Examples include general combustibles reduction where combustible controls
are non-existent, or the addition of a suppression system in a storage occupancy that lacks sprinklers. As the granularity increases in terms of
risk analysis, items are identified that have a significant cost with very little risk improvement. Figure 1 demonstrates this principle. An example
of where risk assessment may go too far is to require extreme measures for minor cuts in intumescent paint that involves shutting down operations to perform
a repair. Intumescent paint is one piece in a series of fire protection features and does not warrant extreme measures that include shutting down overall production
to perform a minor repair on a small scratch. Rather, such a repair can be performed with a high priority that does not impact overall operations.
Multiple layers of protection features create a series of shields that result in preventing an error. An example of such a scenario is if there are two
independent systems that support fire protection in parallel, where both systems need to fail for the system to fail.
Each system has a 5% chance of failure within a given year. What is the expected probability
for the overall system to succeed annually?
Probability for annual success = (1 - 0.05 * 0.05) * 100%
Probability for annual success = 99.75%
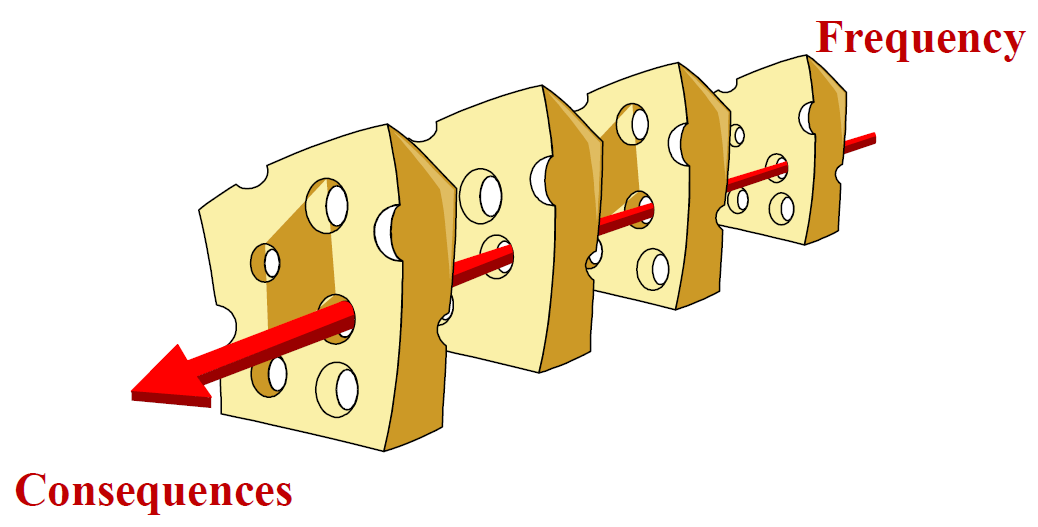
This example highlights that each additional fire protection feature adds another layer of protection. When combined with existing fire protection features,
the newly added feature provides significantly more protection than if it stands by itself. This concept is defined as the "shield" model, also known as the
"Swiss Cheese" model, which is shown in Figure 2:
Figure 2: Swiss Cheese model.
Identifying the risk of a system involves recognizing that risk is the product of the frequency of something occurring and the probability of the occurrence
resulting in a serious casualty. Each of these products is summed to provide an overall risk assessment of a fire protection program.
Risk = Σ (λi * Ci)
λ = frequency of an event
C = consequence of an event
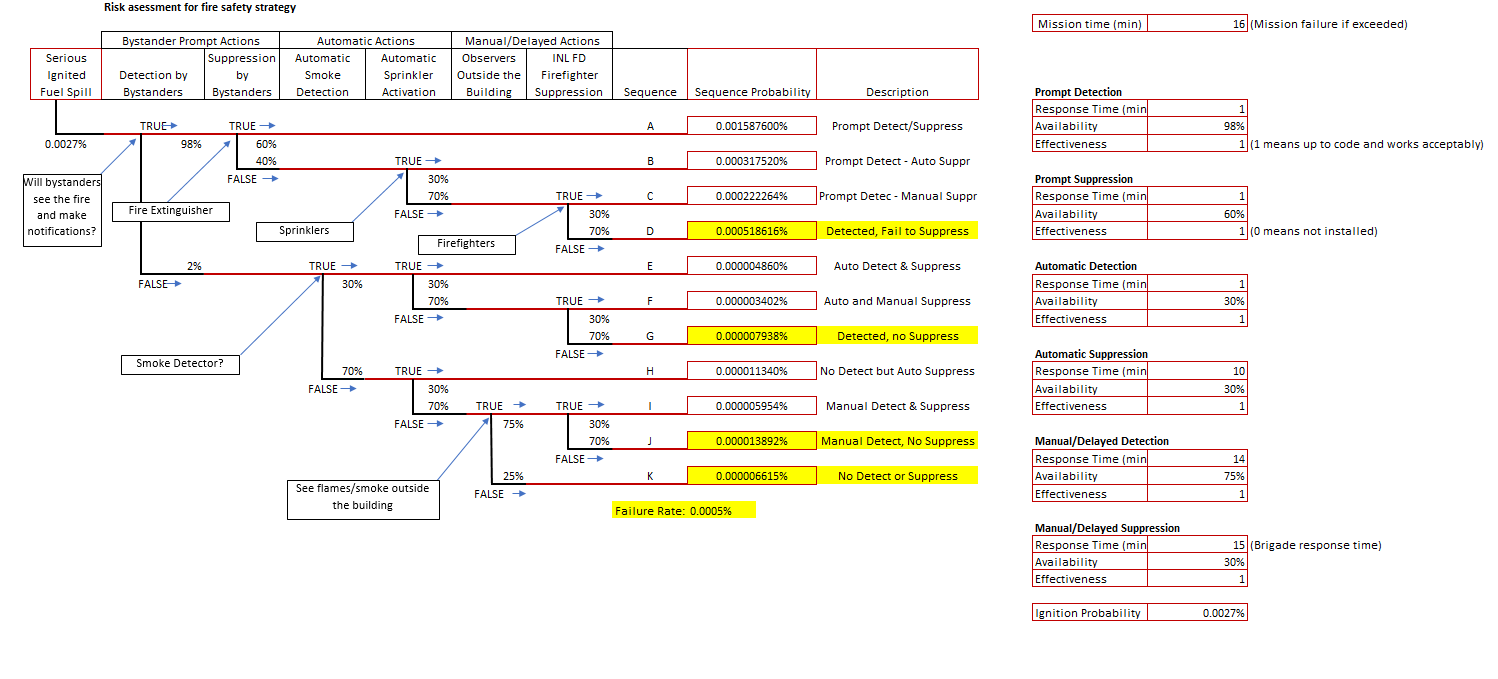
The following is an example of an event tree that helps calculate the risk of a system. The input to this system (0.027%) is the annual frequency of a serious
diesel pool fire that occurs next to a column that supports a critical operation. The values shown in this event tree represent estimates for the performance
of the various systems for this unique application. Such values would likely be different for other buildings at different locations. For instance, suppression
for nuclear facilities is typically identified as 92% effective because of the high IT&M. Only 80% is used for applications where IT&M is less robust for common
industrial applications. 30% is used in this unique application shown in Figure 3 because of the high ceilings in this facility that result in poor suppression performance.
Figure 3: Risk assessment event tree.
Figure 3 shows an event tree with probabilities of failure shown in yellow. These probabilities are summed to provide the overall failure for this system. The
primary challenge for determining risk is to estimate the probability for a casualty. Frequencies can be estimated from existing data. For instance, OSHA
specifies that there is an 11% chance annually for a forklift to be involved in an accident. There is wide variability in terms of defining what an accident is.
Effort needs to be placed into defining common operational definitions before utilizing data from various sources. Another example of frequency is the number of
fires that occur at certain types of facilities within a given year. Published data can be used to estimate that about 18.3 fires occur annually at DOE sites.
This value can used at estimating the expected frequency for a fire within a year at a DOE site if the number of overall DOE buildings are understood and
if the fire safety strategy at each facility is the same.
Some probability data is available from NUREG data sheets. As an example, a Monte Carlo simulation can be performed given NUREG statistical data to provide a probability for
when a design fire can reach a certain target height that is predefined to be a failure. The NFPA handbook also provides some probabilistic data regarding
how successful suppression and automatic detection systems are at activating.
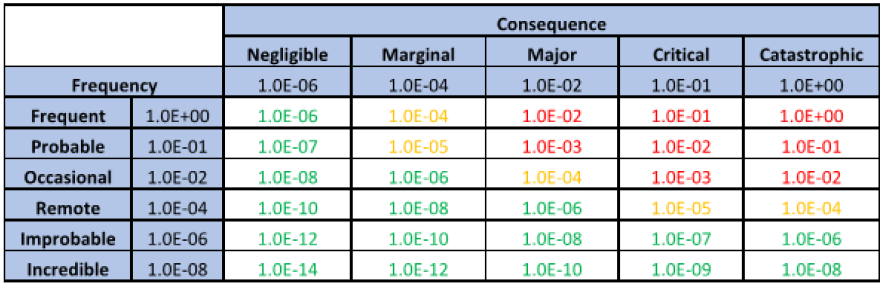
The SFPE Guide to Fire Risk assessment reviews this methodology and provides thresholds for acceptable risk. These thresholds are shown in Figure 4. Engineering
judgement is necessary to appropriately apply the risk values shown.
Figure 4: SFPE Risk Values.
The following example uses the probabilities shown in Figure 3 and identifies the overall risk for an intumescent paint protected column to fail from a fire.
This example facility
has several fire protection features, including sloped floors and trenches to accumulate spilled diesel. Forklifts will be used on occasion within this
facility and could be involved in an accident. This analysis can be used for resolving the concern regarding what level of inspection and quality control
is necessary for intumescent paint IT&M.
There is a 0.0027% annual frequency for a fire to start in a large pool of diesel from a forklift accident at a particular location. This is based upon
a series of assumptions taken from existing data for accidents.
There is also a 98% chance that bystanders will observe the fire and be able to make notifications, a 60% chance that notified bystanders will be able
to use a fire extinguisher and stop the fire while still in the incipient stage, a 30% chance that the automatic smoke detection system will trigger,
a 30% chance that the automatic sprinkler system will activate and control the fire, a 75% chance that observers outside the building will notice that
there is a fire within the building, and a 30% chance that the fire department will respond prior to the fire reaching a point where untreated columns
could be damaged.
The applied intumescent paint will protect the columns from damage based upon a UL 1709 defined pool fire. Slightly damaged intumescent paint will
likely only provide minor degradation for the performance of the paint. It is likely this degradation is on the order of 0.1% for the values provided
by the manufacturer for chips the size of a quarter or a scratch no wider than ¼ inch. Even with damaged paint, the risk is:
5E-9 = 0.1% * 0.0005%
This value is significantly smaller than the acceptable values shown in green within Figure 4.
The calculated risk value is such a small number that no special precautions need to be taken other than
the standard code driven requirement for IT&M for passive barriers.
It is recommended to read the chapters in the SFPE handbook on Probability and Statistics (Chap 73 in 5th edition), Reliability, Availability, and Maintainability
(Chap 74 in 5th edition), and Introduction to Fire Risk Analysis (Chap 72 in 5th edition). It is also recommended to read the SFPE Guide to Fire Risk Assessment.